
Schedule & Results


Team Leaders
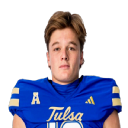 Baylor HayesPassing227 yds · 1 TD · 1 INT
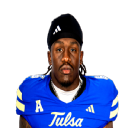 Damari AlstonRushing73 yds · 2 TD · 4.9 avg
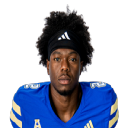 Oran Singleton Jr.Receiving4 rec · 99 yds · 1 TD
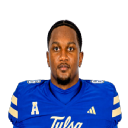 Chris Thompson Jr.Tackles10 tackles · 0 TFL · 0 sacks
Latest on Tulsa
All news →Sam Houston's pass defense is the game's widest edge
Tulsa beats Oklahoma State, 24-10
Oklahoma State lays 14.2 in a Week 1 band where road favorites covered 15 of 45
Roster · 111 players
| # | Player | Pos | Cl | Ht | Wt | Hometown |
|---|---|---|---|---|---|---|
| 5 | Dexter Williams II | QB | SR | 6'1" | 220 | Macon, GA |
| 8 | Kyden Barker | QB | FR | 6'1" | 215 | League City, TX |
| 10 | Baylor Hayes | QB | SO | 6'0" | 185 | Brentwood, TN |
| 12 | Connor Dantzler | QB | FR | 6'1" | 205 | Charleston, SC |
| 15 | Kincayde Eng | QB | FR | 6'3" | 200 | Tulsa, OK |
| 16 | Andrew Alford | QB | FR | 6'0" | 200 | Columbus, GA |
| 19 | Barrett Mullen | QB | FR | 6'2" | 185 | Tulsa, OK |
| 4 | D.J. McKinney | RB | JR | 5'9" | 190 | Tulsa, OK |
| 6 | Damari Alston | RB | SR | 5'10" | 205 | Atlanta, GA |
| 20 | Trequan Jones | RB | SR | 5'9" | 180 | Bartow, FL |
| 21 | Jamarcea Plater | RB | FR | 5'9" | 190 | Shreveport, LA |
| 22 | Kelvin Washington | RB | FR | 5'9" | 170 | Longview, TX |
| 23 | Seth Davis | RB | JR | 5'7" | 185 | Katy, TX |
| 28 | Sevion Morrison | RB | SR | 6'0" | 225 | Tulsa, OK |
| 0 | Donnell Gee Jr. | WR | SO | 5'11" | 180 | Allen, TX |
| 1 | David Wells Jr. | WR | JR | 6'2" | 170 | Lakewood, WA |
| 2 | Oran Singleton Jr. | WR | SR | 6'0" | 165 | Clewiston, FL |
| 3 | Micah Tease | WR | JR | 6'0" | 190 | Tulsa, OK |
| 7 | Jimmy Calloway | WR | SR | 6'0" | 190 | Morrow, GA |
| 9 | Javon Ross | WR | JR | 5'8" | 170 | DeLand, FL |
| 13 | Joshua Rushing | WR | FR | 6'3" | 195 | Lawton, OK |
| 15 | Josh Smith | WR | SO | 6'4" | 225 | Heartland, TX |
| 18 | Courtney Lewis Jr. | WR | FR | 6'0" | 170 | Katy, TX |
| 19 | Grayson Tempest | WR | SR | 5'10" | 190 | Tulsa, OK |
| 26 | Kainon Gibson | WR | FR | 5'9" | 170 | Tulsa, OK |
| 85 | Cole Greene | WR | JR | 5'9" | 180 | Edmond, OK |
| 88 | Xavier Green | WR | FR | 5'10" | 165 | The Colony, TX |
| 11 | Grant McAtee | TE | JR | 6'5" | 220 | Mount Zion, IL |
| 32 | Max Moore | TE | FR | 6'4" | 210 | Mannford, OK |
| 82 | Chris Gacayan II | TE | JR | 6'3" | 245 | Axtell, TX |
| 84 | Jewlyen Roberts | TE | SO | 6'5" | 255 | Dallas, TX |
| 86 | Luke Tevis | TE | FR | 6'5" | 240 | Fort Worth, TX |
| 87 | Jackson Shockley | TE | FR | 6'3" | 235 | Lantana, TX |
| 89 | Kuba Malecki | TE | FR | 6'8" | 245 | Drogheda |
| 50 | Malachi Preciado | OL | SR | 6'2" | 305 | New Orleans, LA |
| 51 | Javion Antai | OL | FR | 6'4" | 300 | Tulsa, OK |
| 52 | Ian Mayes | OL | SO | 6'3" | 300 | Grand Prairie, TX |
| 53 | Jack Hood | OL | SO | 6'5" | 295 | Clayton, GA |
| 54 | Ross Johnston | OL | JR | 6'6" | 315 | Blanchard, OK |
| 56 | Colten Christian | OL | SO | 6'4" | 320 | Collinsville, OK |
| 58 | Dawson Matthews | OL | FR | 6'4" | 280 | Ada, OK |
| 60 | Hunter Erb | OL | SR | 6'6" | 330 | Newark, TX |
| 61 | Brooks Barron | OL | FR | 6'5" | 300 | Owasso, OK |
| 63 | Chaden Sullivan | OL | JR | 6'2" | 300 | Chandler, OK |
| 65 | Nick Anciaux | OL | FR | 6'5" | 260 | Wichita, KS |
| 66 | Will Morris | OL | JR | 6'3" | 300 | Edmond, OK |
| 69 | Ryley Kester | OL | FR | 6'3" | 290 | Jenks, OK |
| 70 | Alan Pond | OL | JR | 6'5" | 300 | Storm Lake, IA |
| 73 | Cam East | OL | SR | 6'8" | 330 | Marrero, LA |
| 74 | Logan Rich | OL | FR | 6'8" | 280 | Rockwall, TX |
| 75 | Evan McClure | OL | SO | 6'4" | 310 | Bixby, OK |
| 76 | Josh Love | OL | SO | 6'2" | 295 | Parker, CO |
| 77 | Brody Duffel | OL | JR | 6'5" | 310 | Bixby, OK |
| 78 | Davis Dotson | OL | SR | 6'6" | 305 | Tulsa, OK |
| 0 | Kyran Duhon | DL | JR | 6'2" | 265 | Lafayette, LA |
| 10 | Arias Nash | DL | SR | 6'2" | 275 | Charlotte, NC |
| 11 | Jaylen George | DL | SR | 6'3" | 295 | Suwanee, GA |
| 15 | Thomas Davis | DL | SR | 6'2" | 235 | Valdosta, GA |
| 21 | Aquavious Dunbar | DL | SO | 6'1" | 255 | Lake Village, AR |
| 30 | Maruio White Jr. | DL | SO | 6'3" | 225 | Arlington, TX |
| 32 | Hudson Ball | DL | SO | 6'3" | 255 | Springdale, AR |
| 40 | Tristan Lawyer | DL | FR | 6'4" | 245 | Frisco, TX |
| 41 | Will Upshaw | DL | SO | 6'3" | 255 | Flower Mound, TX |
| 44 | Kadin Fossung | DL | FR | 6'3" | 220 | Gainesville, GA |
| 56 | Nathan Price | DL | SO | 6'1" | 310 | Owasso, OK |
| 58 | Tyler Rich | DL | JR | 6'2" | 290 | Owasso, OK |
| 88 | Dailen Howard | DL | SR | 6'1" | 275 | Athens, GA |
| 90 | Jayden Madkins | DL | SR | 6'2" | 275 | Houston, TX |
| 91 | Carson Dempsey | DL | FR | 6'3" | 225 | Aledo, TX |
| 99 | Tai Newhouse | DL | SR | 6'3" | 320 | Lawrence, KS |
| 6 | Chris Thompson Jr. | LB | SR | 6'3" | 245 | Desoto, TX |
| 9 | Dax Collins | LB | JR | 6'0" | 210 | Poteau, OK |
| 10 | Ty Anderson | LB | SR | 6'1" | 210 | Thomasville, GA |
| 18 | Raymir Coney | LB | FR | 6'1" | 225 | Cincinnati, OH |
| 24 | Devin Hightower | LB | SR | 6'1" | 230 | Twinsburg, OH |
| 25 | Sam Stone | LB | FR | 6'1" | 225 | Tulsa, OK |
| 33 | William Alexander | LB | JR | 6'2" | 230 | Magnolia, TX |
| 34 | Elijah Wilson | LB | JR | 6'1" | 240 | Duncanville, TX |
| 35 | C.J. Turner | LB | JR | 6'1" | 220 | Star City, AR |
| 38 | Jack Watts | LB | FR | 6'2" | 225 | Nashville, TN |
| 53 | Caleb Bowers | LB | SO | 6'4" | 240 | Dallas, TX |
| 3 | JD Drew | CB | SR | 6'0" | 170 | Tulsa, OK |
| 7 | Elijah Green | CB | JR | 6'2" | 195 | Midwest City, OK |
| 8 | Korbyn Green | CB | SR | 6'0" | 185 | Tulsa, OK |
| 13 | NuNu Campbell | CB | SR | 5'11" | 180 | Tulsa, OK |
| 16 | Caldra Williford | CB | SR | 5'9" | 190 | St. Louis, MO |
| 23 | Willie Goodwyn | CB | SO | 5'11" | 185 | Montgomery, AL |
| 26 | Julian Byrd | CB | FR | 6'1" | 190 | Fairburn, GA |
| 29 | Keynan Farley | CB | FR | 6'0" | 200 | Tulsa, OK |
| 39 | Zach Claton | CB | FR | 6'0" | 170 | Rancho Santa Margarita, CA |
| 2 | Devin Robinson | DB | JR | 6'0" | 210 | Tulsa, OK |
| 22 | Ty Williams | DB | SR | 6'1" | 200 | Muskogee, OK |
| 27 | Zane Woodham | DB | SR | 6'0" | 195 | Tulsa, OK |
| 37 | Rohon Kazadi | DB | FR | 6'2" | 190 | Plano, TX |
| 42 | Reilarean Phillips | DB | FR | 6'0" | 210 | Houston, TX |
| 1 | Zach Williams | S | JR | 6'2" | 195 | Tyler, TX |
| 4 | Tyson Williams | S | SR | 5'10" | 190 | Bixby, OK |
| 5 | Ashton Williams | S | JR | 6'0" | 205 | Trophy Club, TX |
| 12 | Dedaunte Scott | S | SO | 6'0" | 185 | Kennedale, TX |
| 19 | Rylan Leathers | S | SO | 6'0" | 190 | Amarillo, TX |
| 20 | RJ McIntosh | S | FR | 6'1" | 190 | Lucas, TX |
| 28 | Carter Langenderfer | S | FR | 6'1" | 195 | Owasso, OK |
| 46 | Luke Bussman | S | FR | 5'10" | 185 | Southlake, TX |
| 47 | Austin Bussman | S | FR | 5'10" | 185 | Southlake, TX |
| 10 | Owen Carey | PK | FR | 6'2" | 215 | Jacksonville, FL |
| 18 | Marlon Hauck | PK | SR | 6'2" | 200 | Phoenix, AZ |
| 95 | Evan Guenthner | PK | JR | 5'10" | 165 | Noblesville, IN |
| 29 | Max Tulen | P | JR | 6'2" | 200 | Melbourne, VIC |
| 44 | Henry Simon | P | SO | 6'3" | 205 | Tulsa, OK |
| 41 | Joel Bazinet | LS | FR | 5'10" | 210 | Orange Park, FL |
| 42 | Aidan Fedigan | LS | SR | 5'11" | 205 | DeLand, FL |
Team Statistics · per game, with national FBS rank
Rank is national among all FBS teams (#1 = best), oriented so higher rank = better even for defensive and discipline metrics. Bars show percentile.
Scouting Report · 2026 projection
Tulsa is in year 2 under Tre Lamb. The way in is 126th at staying out of the backfield, and they are 109th at throwing it.
Tulsa has played 1 game against a genuinely tough slate, adjusted for here. That football carries about 0% of what is below; the rest is still the preseason projection.
Projected soft spots
- Offensegetting stopped at the line#126projected
- Offensethrowing it#109projected
- Offensesurviving second and twelve#106projected
Each bar is where this team sits in the country. Before the season has produced enough football these are PROJECTIONS — last season regressed to the mean, plus talent, returning production, recruiting and whether the staff is the same one — and the season replaces them as it is played. Head coaches only — there is no free feed for coordinators, so on a program where the head coach does not call the offense this describes the staff he hired. Play-calling identity is a style, not a grade: throwing more than the situations warrant is not better than throwing less than they warrant.
2026 Season Projection
model win prob · 9 to playHow the season could finish · 2026 · chance of each final win total · 9 games left
Every remaining game simulated from the model's win probability for it. Tallest bar is the single likeliest finish, not a prediction that it happens.
Player Value
EPA contribution by position group + estimated NIL market value (derived from position rates and on-field production — not actual deal figures).
Total EPA produced by each positional group this season. OL value is captured via the rush/pass efficiency of skill players; OL-specific EPA isn't separately reported.
Estimated from position-group market rates and on-field EPA contribution. Actual NIL valuations depend on social media following, brand fit, and market negotiations — these figures are directional only.
The Five Factors
ranked vs. FBS · bar = betterOpponent-adjusted efficiency
EPA/play vs. schedulePass vs. rush (PPA)
Trenches & disruption
- Line yards (off)
- 2.76#100
- 2nd-level / open-field
- 0.85 / 0.61
- Power / stuff (off)
- 100.0% / 15.2%
- Havoc — total (def)
- 10.2%#126
- Havoc — front 7 / DB
- 5.7% / 4.5%
Standard vs. passing downs
ProPPA on each down type (off vs. def).
Opponent-adjusted by down
Pro| 1st | 2nd | 3rd | |
|---|---|---|---|
| Offense | 0.08#67 | 0.35#50 | -0.06#130 |
| Defense | -0.36#11 | 0.26#97 | 0.19#38 |
Elo Trajectory
Team Fingerprint · 2026 · 43 opponent-adjusted metrics · percentile vs 138 FBS teams
Plot these →Efficiency
- Offense EPA/play0.1944th
- Defense EPA/play allowed-0.0775th
- Offense success rate41%36th
- Defense success rate allowed36%55th
Downs
- Offense success — standard downs58%77th
- Offense success — passing downs10%3rd
- Defense success allowed — standard downs36%72nd
- Defense success allowed — passing downs37%22nd
Explosiveness
- Offense explosiveness1.126th
- Defense explosiveness allowed1.079th
- Offense explosiveness — standard downs1.046th
- Offense explosiveness — passing downs2.054th
Trenches
- Offense line yards2.831st
- Defense line yards allowed2.847th
- Offense highlight yards0.6134th
- Defense highlight yards allowed0.3172nd
- Offense power success1.099th
- Defense power success allowed0.5079th
- Offense stuff rate0.1551st
- Defense stuff rate0.2260th
Third down
- Third down conversion10%3rd
- Third down distance faced8.59th
- Third down conversion allowed33%60th
- Third down distance forced6.526th
Halves
- Net success rate — first half-0.0330th
- Net success rate — second half0.1055th
Drives
- Points per drive2.258th
- Points per drive allowed0.9180th
- Average starting field position3790th
- Opponent starting field position2196th
- Available yards gained50%56th
- Available yards allowed47%52nd
- Scoring opportunities per drive100%99th
- Scoring opportunities allowed64%87th
- Points per scoring opportunity2.237th
- Points allowed per opportunity1.481st
- Three-and-out rate18%73rd
- Three-and-outs forced9%15th
Roster
- Returning usage40%47th
- Returning EPA89.644th
- Team talent composite62339th
- Recruiting class rank93.033rd
- Recruiting class points17933rd
Every metric is opponent-adjusted and ranked so that higher is always better — a defensive rate that is good when low is ranked accordingly. Sack and tackle-for-loss composition are deliberately absent: their relationship to team quality is a measured null, so they carry a style rather than a rank, and they appear in the pressure signature instead.
Intelligence Report
Offensive DNA
Pass efficiency edge: 0.405 EPA/play
Defensive Identity
Disruption comes evenly from front and secondary.
Season Signature
2-0 record through 2 games.
Team Shape · percentile vs. FBS · dashed = 50th
Each axis = national percentile rank. 100th = best in FBS, 0th = worst. Defense and Havoc are oriented so higher = better.
CORE efficiency · situation and opponent removed
Points per 100 plays above average, after the game state is regressed out of every snap and the schedule is solved out across the whole league. The version of this team’s efficiency that can be compared to a team it never played.
What a possession is worth · 11 drives
Play-calling identity
Against what the league calls from the same down, distance, field position, score and clock — so this is the staff, not the game script.
- Pass rate
- 42.9%
- Expected, given the spots
- 45.9%
- Over expected
- -3.0
- Fourth down vs peers
- +2
- Fourth down vs the model
- +0
National Landscape · 2026 FBS · offense vs. defense EPA/play
Each dot = one FBS team. Tulsa is highlighted. Tap or hover a dot for details.
Similar Programs
Teams with the closest offense + defense efficiency profile to Tulsa in 2026


Similarity = normalized Euclidean distance on season offensive and defensive EPA/play. Teams within ±0.02 EPA/play on both units score >90%.
Program Trajectory · CORE rating · 2015–2026 · points per game vs an average FBS team
Program History
recent seasons| Year | Overall | Conf | Win % | xW | Luck |
|---|---|---|---|---|---|
| 2026 | 1-0 | 0-0 | 100% | 1.0 | +0.0 |
| 2025 | 4-8 | 1-7 | 33% | 5.0 | -1.0 |
| 2024 | 3-9 | 1-7 | 25% | 3.1 | -0.1 |
| 2023 | 4-8 | 2-6 | 33% | 5.4 | -1.4 |
| 2022 | 5-7 | 3-5 | 42% | 5.0 | +0.0 |
| 2021 | 7-6 | 5-3 | 54% | 8.0 | -1.0 |
| 2020 | 6-3 | 6-1 | 67% | 6.2 | -0.2 |
| 2019 | 4-8 | 2-6 | 33% | 6.0 | -2.0 |
| 2018 | 3-9 | 2-6 | 25% | 3.6 | -0.6 |
| 2017 | 2-10 | 1-7 | 17% | 3.6 | -1.6 |
xW = expected wins from per-game dominance. Luck = actual − expected (positive = won close games).
1-0 so far, projected to finish 8.4-3.9. Wins the American Athletic in 11%.
If they finish with…
Their chance of making it at each final loss count. Better than even up to 0.
Win out and it is 93%. One bid goes to the best champion outside the four power leagues, so running the table only enters them into that argument.
up 3.2 points since preseason — won 24-10 over Oklahoma State against an expected margin of −11, so +24.6 against the number.
- At 1 loss they are 37% where the average American Athletic team is 52%.
- The American Athletic takes 0.34 bids in an average season.
- One bid goes to the best champion outside the P4. They take it in 4.2% of seasons, having won their league in 92% of those.
Tulsa’s own turning points
Points of playoff probability between winning and losing.
- wk4at Arkansas9.5
- wk6at Navy9.0
- wk13at UTSA8.0
- wk10at Tulane7.1
- wk8vs Army6.5
- wk11vs Florida Atlantic5.3
Who to root for
Games Tulsa is not in that move its odds most. Same units, much smaller scale.
- wk9Notre Dame over Navy1.4
- wk3Oklahoma over New Mexico1.3
- wk6Kent State over Western Michigan1.3
- wk6Fresno State over Boise State1.1
- wk13Charlotte over Navy1.0
- wk10Colorado State over Boise State0.9
American Athletic
0-0 in league play, projected 5.1-2.94 of 14 by title oddsThe American Athletic sends its top two by conference winning percentage, head-to-head breaking a tie. The last berth is level on percentage in 33% of simulated seasons, so a tiebreaker decides it about that often.
- wk6Tulsa at Navy17.9
- wk13Tulsa at UTSA17.4
- wk10Tulsa at Tulane14.8
- wk8Army at Tulsa13.9
Points of title probability riding on each result. The whole American Athletic race →
If not the playoff, then
Tulsa is 1-0 and needs 5 more wins from 11 games to reach the six that make a team eligible — at most one of which may come against an FCS opponent. In 8.7% of seasons they get there and still go nowhere: there are more eligible teams than seats.
- Gasparilla Bowl20%
- Military Bowl13%
- Fenway Bowl11%
- Armed Forces Bowl8.6%
- Birmingham Bowl7.8%
- First Responder Bowl7.2%
Recruiting Pipelines
since 2010Of the 170 high-school programs with a pipeline page here, 3 have sent Tulsa a player since 2010 — 9 signees between them. Where they signed, not where they were offered, and not a complete list of Tulsa's feeder schools: only these 170 have the outcome history to measure.